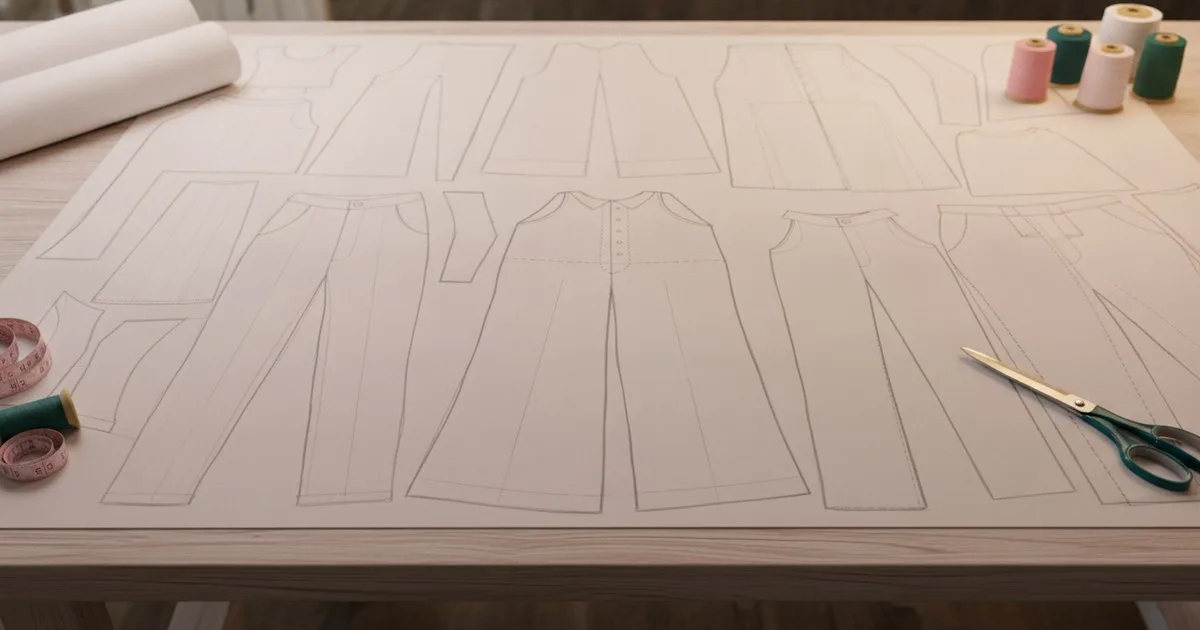
Every yard of fabric your factory cuts that does not end up in a finished garment is money your costing sheet never recovers. Marker planning — the process of arranging pattern pieces on a virtual sheet of fabric before cutting — is where that loss is either controlled or locked in. Get it right and your fabric consumption per unit drops; accept a lazy marker and you pay for it on every single unit in the run.
Key Takeaways
- Marker efficiency is the ratio of pattern-piece area to total marker area; higher efficiency means less fabric waste per unit.
- Grain-line constraints and fabric width are the two biggest physical limits on how tightly pieces can nest.
- A marker report gives you the efficiency percentage, yardage per unit, and fabric utilisation — use it to challenge factory estimates before you sign off on a BOM.
- Nesting software can test dozens of layout combinations in minutes; manual spreading cannot.
- Material costs are a major component of total production cost, so even a small efficiency gain compounds across a full production run.
What is a marker, and why does it matter?
A marker is a full-scale digital layout of all the pattern pieces needed for one or more sizes of a garment, arranged on a rectangle that represents your fabric width. The marker is sent to the cutting room, where it is either printed on paper and laid over the fabric, or fed directly to an automated cutter.
The marker matters because it is the last point at which you can reduce fabric waste before the scissors — or the blade — moves. Once the cut is made, any fabric outside the pattern pieces is gone. In a production run of thousands of units, the difference between a marker at 82% efficiency and one at 88% efficiency can represent a meaningful reduction in fabric cost per unit.
As research into optimised nesting methods confirms, waste reduction is the primary goal of marker planning, and material costs play a major role in total production cost.
How is marker efficiency calculated?
Marker efficiency is expressed as a percentage:
Marker efficiency (%) = (Total area of pattern pieces ÷ Total marker area) × 100
If your pattern pieces cover 1.8 square metres and your marker is 2.2 square metres, efficiency is about 82%. The remaining 18% is waste — selvedge allowances, gaps between pieces, and the unusable triangles that accumulate around curved hems and armholes.
A few things that push efficiency down:
- Grain-line constraints. Most woven pieces must be cut on grain. That means you cannot rotate a piece freely to fill a gap — you can only flip it or shift it along the grain axis.
- Nap and directionality. Pile fabrics, prints with a direction, and fabrics with a sheen all require pieces to face the same way, which rules out the 180-degree flips that often improve nesting.
- Narrow fabric width. A 44-inch fabric forces more rows of pieces than a 58-inch fabric, creating more awkward gaps at the selvedges.
- Complex shapes. Curved side seams and shaped collars leave more interstitial space than straight-sided pieces.
What does a marker report contain?
When a factory or a CAD operator produces a marker, the software generates a marker report alongside it. This is the document your production team should request and review — not just accept the yardage figure the factory quotes.
A standard marker report includes:
- Marker length and width — the physical dimensions of the layout.
- Efficiency percentage — the ratio described above.
- Yardage per unit (sometimes called fabric consumption per unit) — derived by dividing total marker length by the number of garments nested in that marker.
- Number of plies — how many layers of fabric will be spread and cut simultaneously.
- Size ratio — which sizes are included in the marker and in what proportion.
The yardage-per-unit figure feeds directly into your bill of materials. If the factory quotes you a consumption figure without showing you the marker report, you have no way to verify whether their number reflects a well-optimised layout or a rushed one.
How to read a marker report and challenge a factory estimate
Here is a practical sequence for reviewing a marker report before you approve a BOM.
-
Request the marker file and the report together. A PDF of the marker layout plus the efficiency summary is standard output from any professional CAD system.
-
Check the efficiency percentage against the fabric type. For a plain woven fabric with no nap, a well-run factory should achieve somewhere in the low-to-mid eighties or better on most styles. If the reported efficiency is in the seventies, ask why.
-
Verify the fabric width used. Confirm that the marker was built to the actual width of the fabric you are supplying, not a default. A marker built to 58 inches run on 54-inch fabric will have pieces falling off the edge.
-
Cross-check yardage per unit against your own estimate. If you have graded patterns, you can estimate consumption by calculating the bounding-box area of all pieces for one size, adding a reasonable waste factor, and dividing by fabric width. A factory figure that is significantly higher than your estimate warrants a conversation.
-
Ask whether the marker includes all components. Facings, waistbands, pockets, and interfacing pieces are sometimes quoted separately. Make sure the marker covers every self-fabric piece in your tech pack.
-
Check the size ratio. A marker built for a single size will have different efficiency than one that nests a ratio of small, medium, and large together. Confirm the ratio matches your actual order breakdown.
Which software tools are used for marker making?
Professional nesting is done in dedicated CAD software. Three tools your production team is likely to encounter:
Gerber AccuMark is a pattern-making and marker-making suite used widely by apparel manufacturers. It handles grading, marker planning, and fabric nesting, and produces the marker reports described above. AccuMark is now part of Lectra's broader CAD and automation portfolio.
Optitex offers 2D pattern CAD, marker making, and nesting alongside 3D garment visualisation. It operates as part of FOG Software Group. Its nesting module can run automatic optimisation across multiple size combinations.
TUKAcad from Tukatech includes a dedicated marker-making module called SMARTmark, which handles material requirement planning alongside nesting. It is part of Tukatech's wider ecosystem that spans 2D pattern making, automatic pattern making, and 3D virtual design.
All three tools produce marker reports in formats that can be shared with your factory or reviewed internally. If your factory uses a different system, the report structure will be similar — efficiency percentage, yardage, and marker dimensions are standard outputs.
Where does marker planning connect to your BOM and tech pack?
The fabric consumption figure that comes out of a marker feeds directly into the bill of materials. As the BOM is a core document in product development — used for sourcing, costing, and supplier collaboration — an inaccurate yardage figure at the marker stage propagates into every downstream cost calculation.
If your tech pack specifies a fabric width and the factory builds the marker to a different width, the consumption figure will be wrong. If the marker excludes a facing piece, the BOM will undercount fabric. These are not hypothetical errors; they are common sources of cost overruns that surface only when the cutting room runs short.
Building the habit of reviewing marker reports before you sign off on a BOM is one of the most direct ways a production team can protect cost targets.
What is still unsolved in marker planning?
Even with good software, a few problems remain genuinely hard:
- Mixed-fabric styles. When a garment uses two or three different fabrics, you need a separate marker for each, and the efficiency of each must be managed independently.
- Remnant management. The fabric left at the end of a roll after cutting is rarely zero, and how factories account for remnants varies. Some absorb the cost; others charge it back.
- Last-minute size changes. If a buyer revises the size ratio after the marker is built, the marker needs to be rebuilt. Factories do not always flag this; they may simply adjust the yardage figure without explaining why.
- Stripe and check matching. Patterns that require matching at seams force pieces to be placed at fixed intervals, which can drop efficiency significantly. The cost of matching is real and should be reflected in your costing.
FAQ
What is a good marker efficiency percentage for woven apparel? For plain woven fabrics without nap or directional print, a well-optimised marker typically falls in the low-to-mid eighties or above. Styles with many curved pieces or strict grain requirements will sit lower. Anything below the low seventies on a simple style is worth questioning.
Can I calculate fabric consumption without a marker? You can estimate it by summing the bounding-box areas of all pattern pieces for a given size, adding a waste factor, and dividing by fabric width. It is a useful sanity check, but it will always be less accurate than an actual nested marker because it does not account for how pieces interlock.
Why do factories sometimes quote higher yardage than the marker shows? Factories build in a buffer for spreading loss, end-of-roll remnants, and re-cuts due to fabric defects. Some buffer is legitimate; an unexplained gap between the marker yardage and the quoted yardage is worth discussing line by line.
How does nap or print direction affect fabric cost? Directional fabrics require all pieces to face the same way, which removes the 180-degree flip that often allows pieces to nest more tightly. The result is lower marker efficiency and higher consumption per unit. This cost should be factored into your fabric estimate before you commit to a price.
Where does the marker report sit in the handover from design to production? The marker report is a production document, not a design document. It should be generated after patterns are finalised and graded, and reviewed before the BOM fabric quantities are locked. Treating it as an afterthought — something the factory handles without oversight — is where consumption errors typically enter the cost sheet.
Further Reading
- Efficiency marker evaluation based on optimised deep learning methods
- Bill of Materials in Fashion — NetSuite
- The Ultimate Guide to Tech Packs in Clothing